11 KiB
lab
| lab | ||||
|---|---|---|---|---|
|
Lab 11 - Implement Monitoring
Lab introduction
In this lab, you learn about Azure Monitor. You learn to create an alert to be sent to an action group. You trigger the alert and check the activity log.
This lab requires an Azure subscription. Your subscription type may affect the availability of features in this lab. You may change the region, but the steps are written using East US.
Estimated timing: 40 minutes
Lab scenario
Your organization has migrated their infrastructure to Azure. It is important that Administrators are notified of any significant infrastructure changes. You plan to examine the capabilities of Azure Monitor, including Log Analytics.
Interactive lab simulation
There is an interactive lab simulation that you might find useful for this topic. The simulation lets you to click through a similar scenario at your own pace. There are differences between the interactive simulation and this lab, but many of the core concepts are the same. An Azure subscription is not required.
- Implement monitoring. Create a Log Analytics workspace and Azure-automation solutions. Review monitoring and diagnostic settings for virtual machines. Review Azure Monitor and Log Analytics functionality.
Architecture diagram
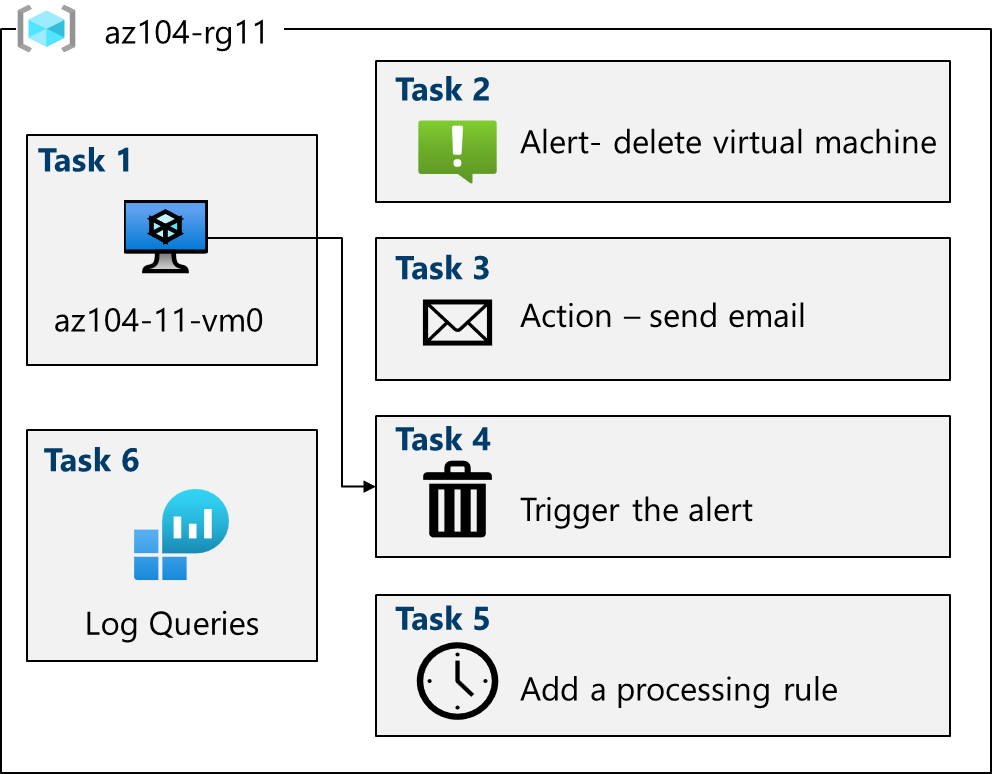
Tasks
- Task 1: Provision the lab environment.
- Task 2: Create the Azure activity log alert.
- Task 3: Trigger the alert.
- Task 4: Add an alert rule.
- Task 5: Use Azure Monitor log queries.
Task 1: Provision the lab environment
In this task, you will deploy a virtual machine that will be used to test monitoring scenarios.
-
If necessary, download the \Allfiles\Lab11\az104-11-vm-template.json and \Allfiles\Labs\11\az104-11-vm-parameters.json lab files to your computer.
-
Sign in to the Azure portal -
https://portal.azure.com. -
From the Azure portal, search for and select
Deploy a custom template. -
On the custom deployment page, select Build you own template in the editor.
-
On the edit template page, select Load file.
-
Locate and select the \Allfiles\Labs11\az104-11-vm-template.json file and select Open.
-
Select Save.
-
Use the following information to complete the custom deployment fields, leaving all other fields with their default values:
Setting Value Subscription Your Azure subscription Resource group az104-rg11(If necessary, select Create new)Region East US Username StudentPassword Provide a complex password -
Select Review + Create, then select Create.
-
Wait for the deployment to finish, then click Go to resource group.
-
Review what resources were deployed including a virtual machine and virtual network.
Configure Azure Monitor (this will be used in the last task)
-
In the portal, search for and select Monitor.
-
Take a minute to review all the insights, detection, triage, and diagnosis tools that are available.
-
Select View in the VM Insights box, and then select Configure Insights.
-
Select your virtual machine, and then Enable (twice).
-
Take the defaults for subscription and data collection rules, then select Configure.
-
It will take a few minutes for the virtual machine agent to install and configure, proceed to the next step.
Task 2: Create the Azure activity log alert
In this task, you create an alert for when a virtual machine is deleted.
-
On the Azure portal search for and select Monitor.
-
In the Monitor menu, select Alerts.
-
Select Create + and select Alert rule.
-
Select the box for the az104-rg11 resource group, then select Apply. This alert will apply to any virtual machines in the resource group. Alternatively, you could just specify one particular machine.
-
Select the Condition tab and then select the See all signals link.
-
Search for and select Delete Virtual Machine (Virtual Machines). Notice the other built-in signals. Select Apply
-
You want to receive alerts of all types, so leave Alert logic settings at their default of All selected.
-
Leave the Create an alert rule pane open for the next section.
Task 3: Add an email alert action
In this task, if the alert is triggered an email notification will be sent to the operations team.
-
On the Create an alert rule pane, select the Next: Actions button, and select Create action group.
-
On the Basics tab, enter the following values for each setting.
Setting Value Project details Subscription your subscription Resource group az104-rg11 Region Global (default) Instance details Action group name Alert the operations team(must be unique in the resource group)Display name AlertOps Team -
Select Next: Notifications and enter the following values for each setting.
Setting Value Notification type Select Email/SMS message/Push/Voice Name VM was deleted -
Select Email, and in the Email box, enter your email address, and then select OK.
-
The Create an alert rule pane reappears. Select the Next: Details button and enter the following values for each setting.
Setting Value Alert rule name VM was deleted Description A VM in your resource group was deleted -
Select Review + create to validate your input, then select Create.
Note: You should receive an email notification saying you were added to an action group.
Task 4: Trigger the alert
In this task, you trigger the alert and confirm a notification is sent.
Note: It can take up to five minutes for an activity log alert rule to become active. In this exercise, if you delete the virtual machine before the rule deploys, the alert rule might not be triggered.
-
On the Azure portal menu or from the Home page, select Virtual machines.
-
Check the box for the az104-vm0 virtual machine.
-
Select Delete from the menu bar.
-
Check the box for Apply force delete. Check the box to acknowledge the deletion, then select Delete.
-
In the title bar, select the Notifications icon and wait until vm0 is successfully deleted.
-
You should receive a notification email that reads, Important notice: Azure Monitor alert VM was deleted was activated... If not, open your email program and look for an email from azure-noreply@microsoft.com.

Note: There is no need to wail on the email, continue on.
-
On the Azure portal resource menu, select Monitor, and then select Alerts in the menu on the left.
-
You should have three verbose alerts that were generated by deleting vm0.
-
Select the name of one of the alerts (For example, VM was deleted). An Alert details pane appears that shows more details about the event.
Task 5: Add an alert rule
In this task, you create an alert rule to suppress notifications during maintenance periods.
-
Continue in the Alerts blade, select Alert processing rules and then + Create.
-
Select your resource group, then select Apply.
-
Select Next: Rule settings, then select Suppress notifications.
-
Select Next: Scheduling.
-
By default, the rule works all the time, unless you disable it. We're going to define a rule to suppress notifications during overnight planned maintenance. Enter these settings for the scheduling of the alert processing rule:
Setting Value Apply the rule At a specific time Start Enter today's date at 10pm. End Enter tomorrow's date at 7am. Time zone Select the local timezone. 
-
Select Next: Details and enter these settings:
Setting Value Resource group az104-rg11 Rule name Planned MaintenanceDescription Suppress notifications during planned maintenance. -
Select Review + create to validate your input, then select Create.
Task 6: Use Azure Monitor log queries
In this task, you will use Azure Monitor to query the data captured from the virtual machine.
-
In the Azure portal, search for and select
Monitorblade, click Logs.Note
: You might need to click Get Started if this is the first time you access Log Analytics. If you still see an Enable button, wait for the previous deployment to finish.
-
If necessary, click Select scope, on the Select a scope blade, expand your subscription, expand resource group az104-rg1, then select az104-vm0, and click Apply.
-
In the query window, paste the following query, click Run, and review the resulting chart:
// Virtual Machine available memory
// Chart the VM's available memory over the last hour.
InsightsMetrics
| where TimeGenerated > ago(1h)
| where Name == "AvailableMB"
| project TimeGenerated, Name, Val
| render timechart
Note
: The query should not have any errors (indicated by red blocks on the right scroll bar). If the query will not paste without errors, paste the query code into a text editor such as Notepad, and then copy and paste it into the query window from there.
-
Click Queries in the toolbar,
Note
: Depending on your screen resolution, Queries might be hidden behind an elipses.
-
Clear any existing filters. Using the query search, search for
Track VM Availability using Heartbeatthen select Run. -
Select the Results tab of the query and review the results of the query.
Review the main points of the lab
Congratulations on completing the lab. Here are the main takeaways for this lab.
-
Alerts help you detect and address issues before users notice there might be a problem with your infrastructure or application.
-
You can alert on any metric or log data source in the Azure Monitor data platform.
-
An alert rule monitors your data and captures a signal that indicates something is happening on the specified resource.
-
An alert is triggered if the conditions of the alert rule are met. Several actions (email, SMS, push, voice) can be initiated and sent to an action group.
Cleanup your resources
If you are working with your own subscription take a minute to delete the lab resources. This will ensure resources are freed up and cost is minimized. The easiest way to delete the lab resources is to delete the lab resource group.
-
In the Azure portal, select the resource group, select Delete the resource group, Enter resource group name, and then click Delete.
-
Using Azure PowerShell,
Remove-AzResourceGroup -Name resourceGroupName. -
Using the CLI,
az group delete --name resourceGroupName.